Rainwater insights
Exploring Rainfall and Rainwater Harvesting Potential in Plum Creek Conservation District
Published November 1, 2026
Published by Rainwater Calculator · Updated November 1, 2026
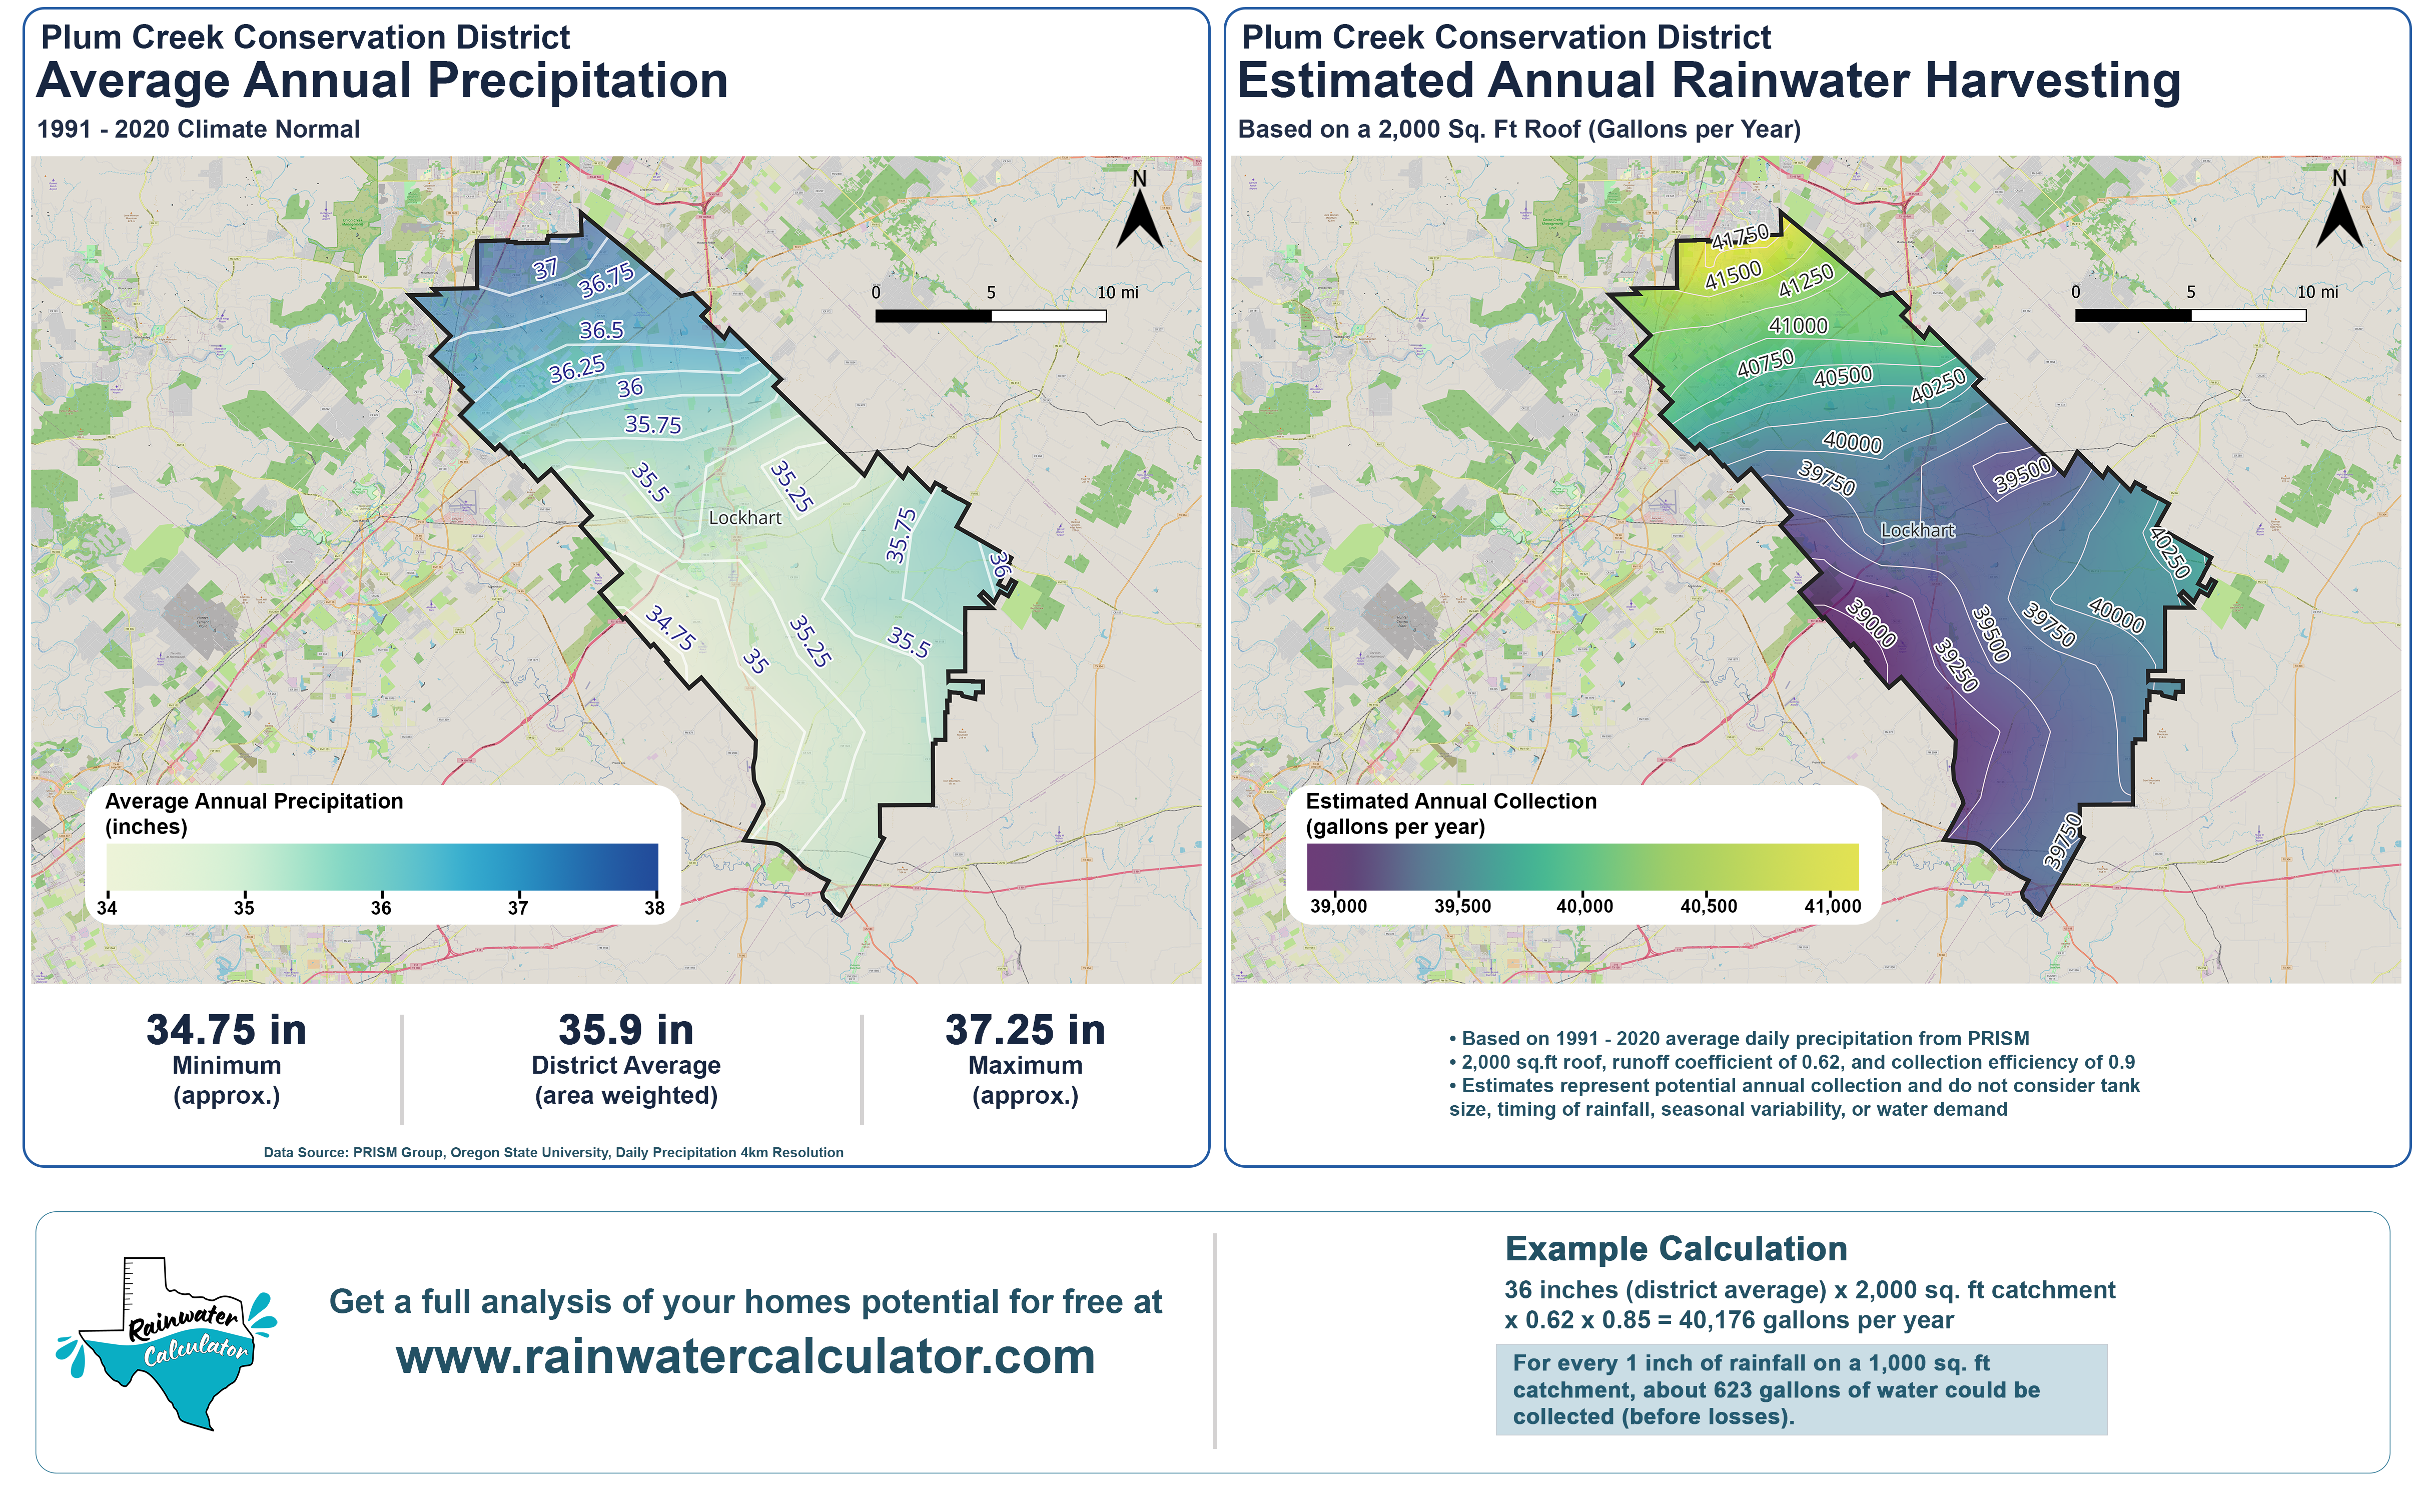
How much rain falls across a groundwater conservation district, and what does that mean for rainwater harvesting? We recently completed a precipitation analysis for the Plum Creek Conservation District in Central Texas, using historical rainfall data to better understand precipitation patterns, long-term variability, and potential rainwater collection. The study uses daily precipitation estimates from the PRISM Climate Group at Oregon State University, with historical records dating back to 1982 and the 1991–2020 climate normal as a reference.
Understanding Local Rainfall Patterns
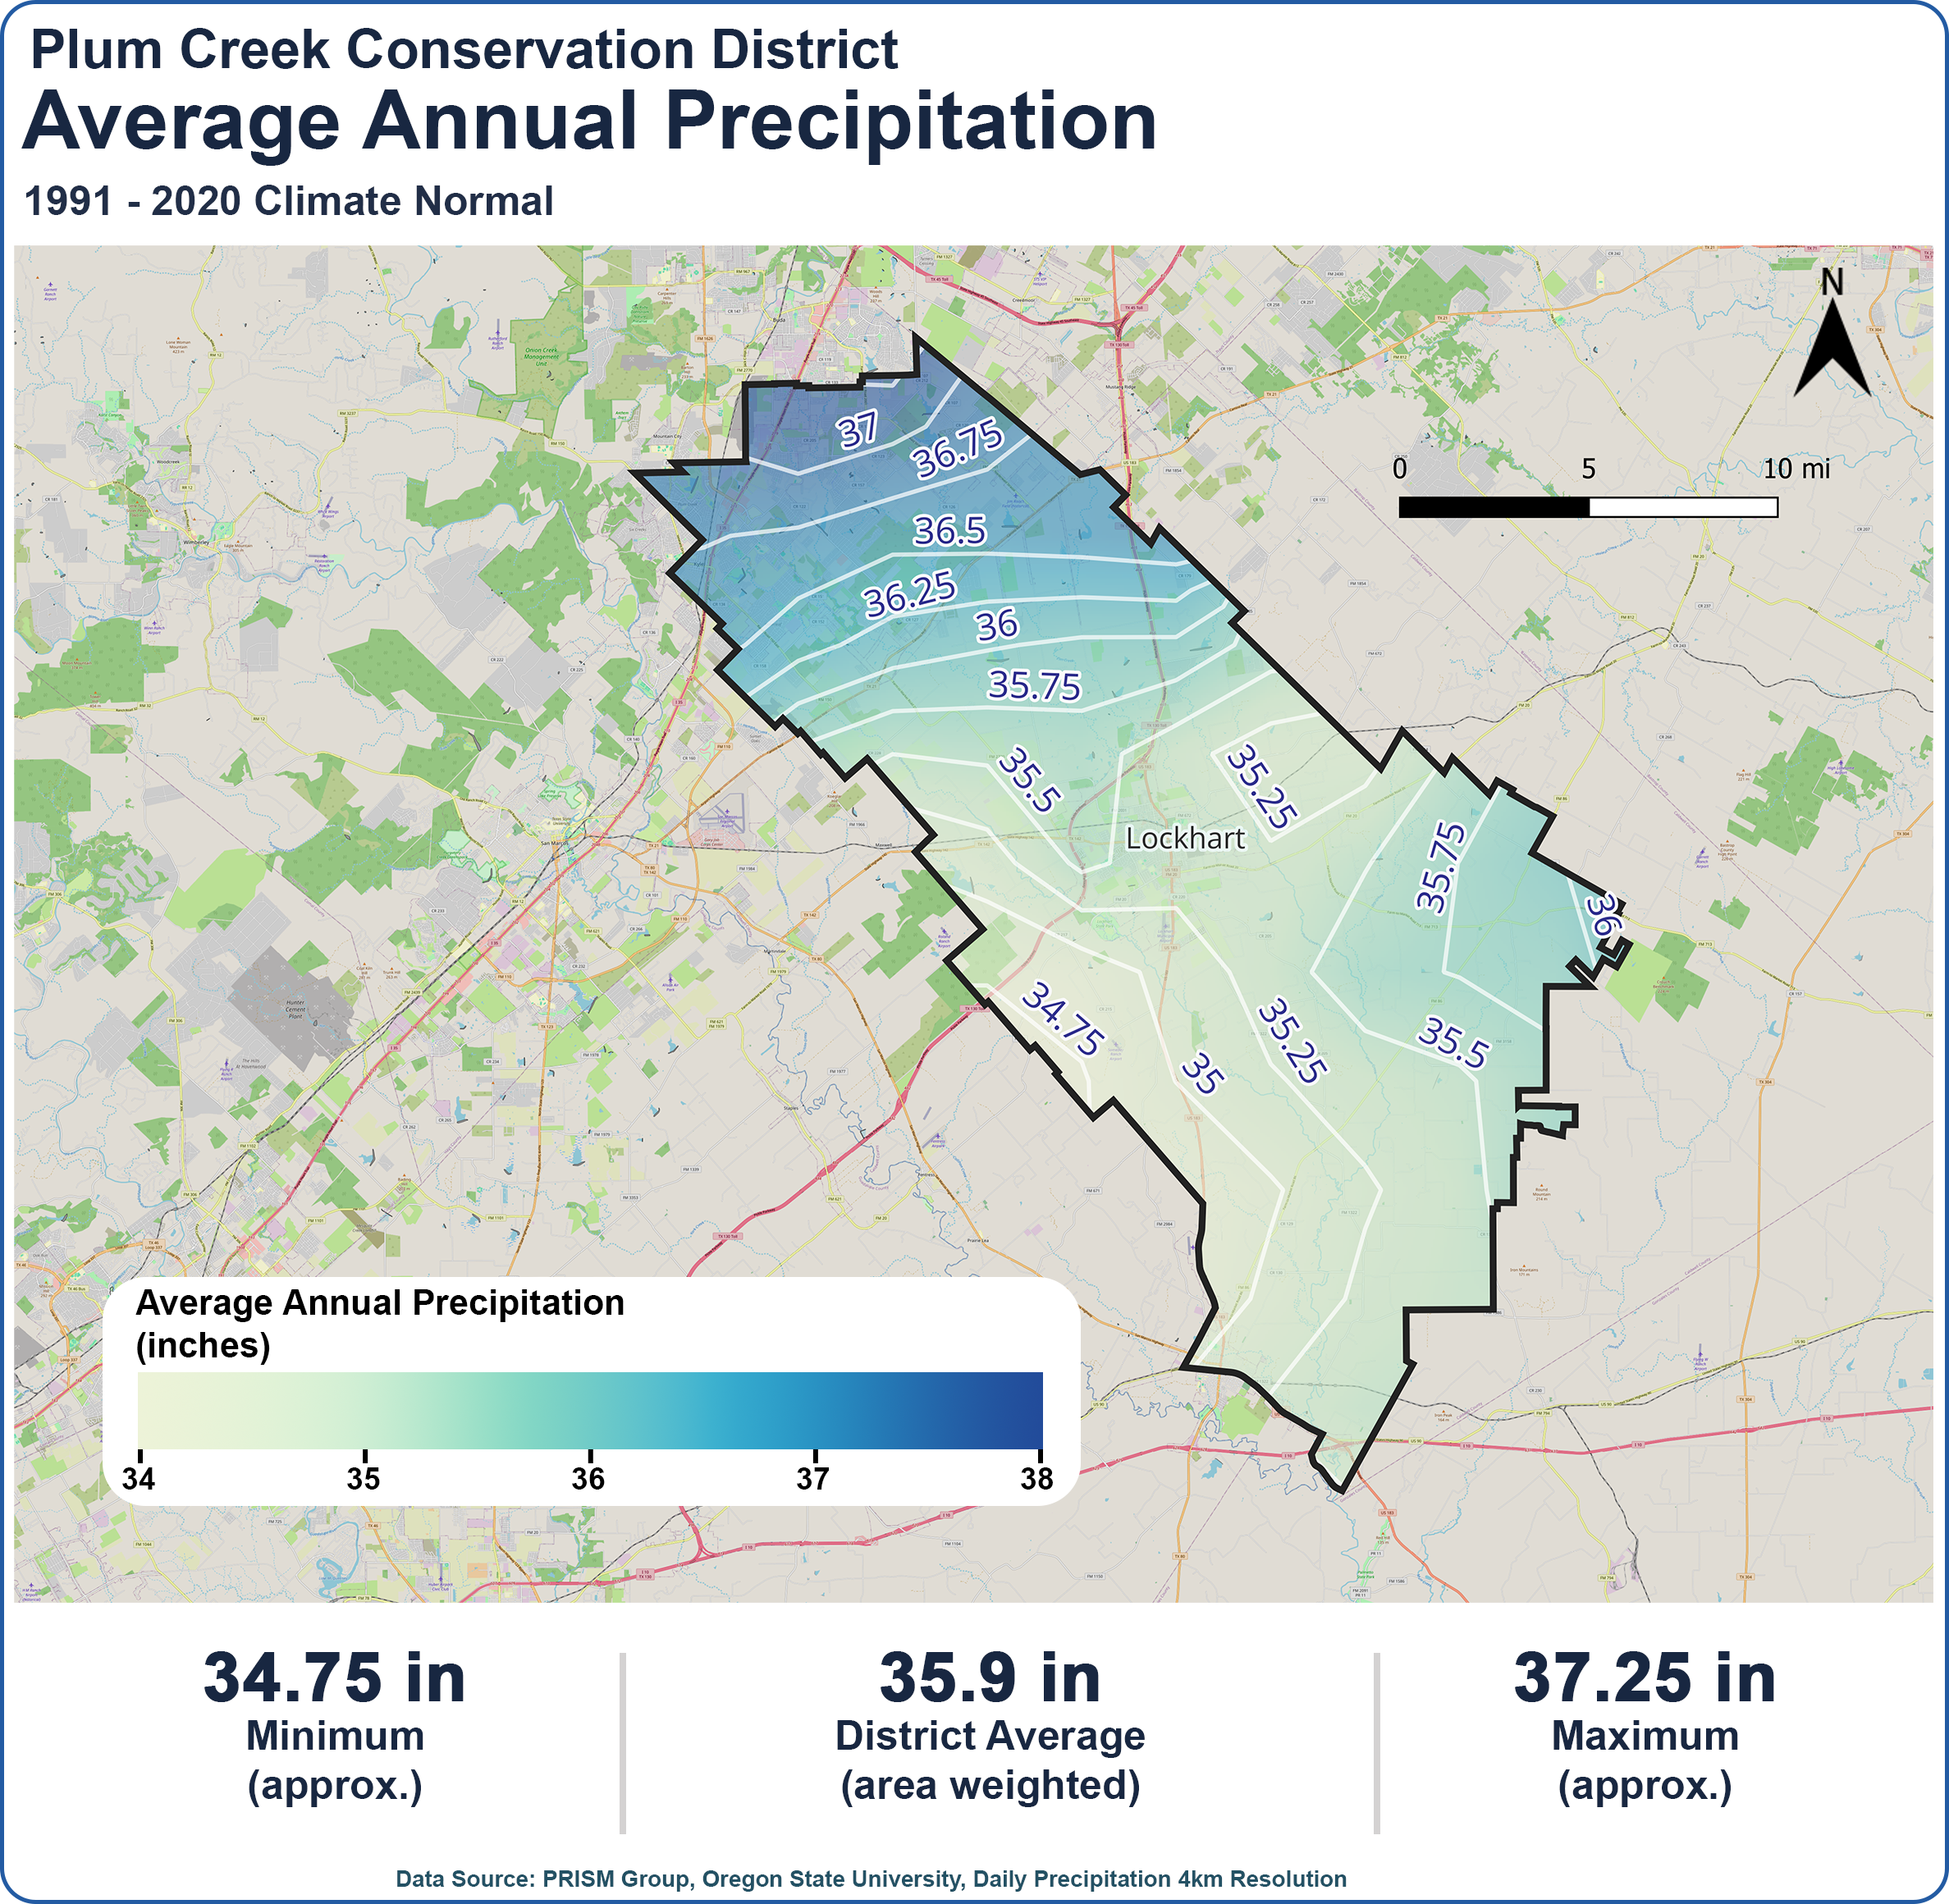
The analysis found that the District receives an area-weighted average of approximately 35.9 inches of precipitation annually, based on the 1991–2020 climate normal. However, precipitation is not evenly distributed. Average annual rainfall ranges from approximately 34.75 inches in the southwestern portion of the District to 37.25 inches in the north. While this difference may seem small, it can translate into meaningful differences in available water for rainwater harvesting systems. Mapping these variations helps illustrate why local rainfall data is important when evaluating collection potential.
Translating Rainfall Into Harvesting Potential
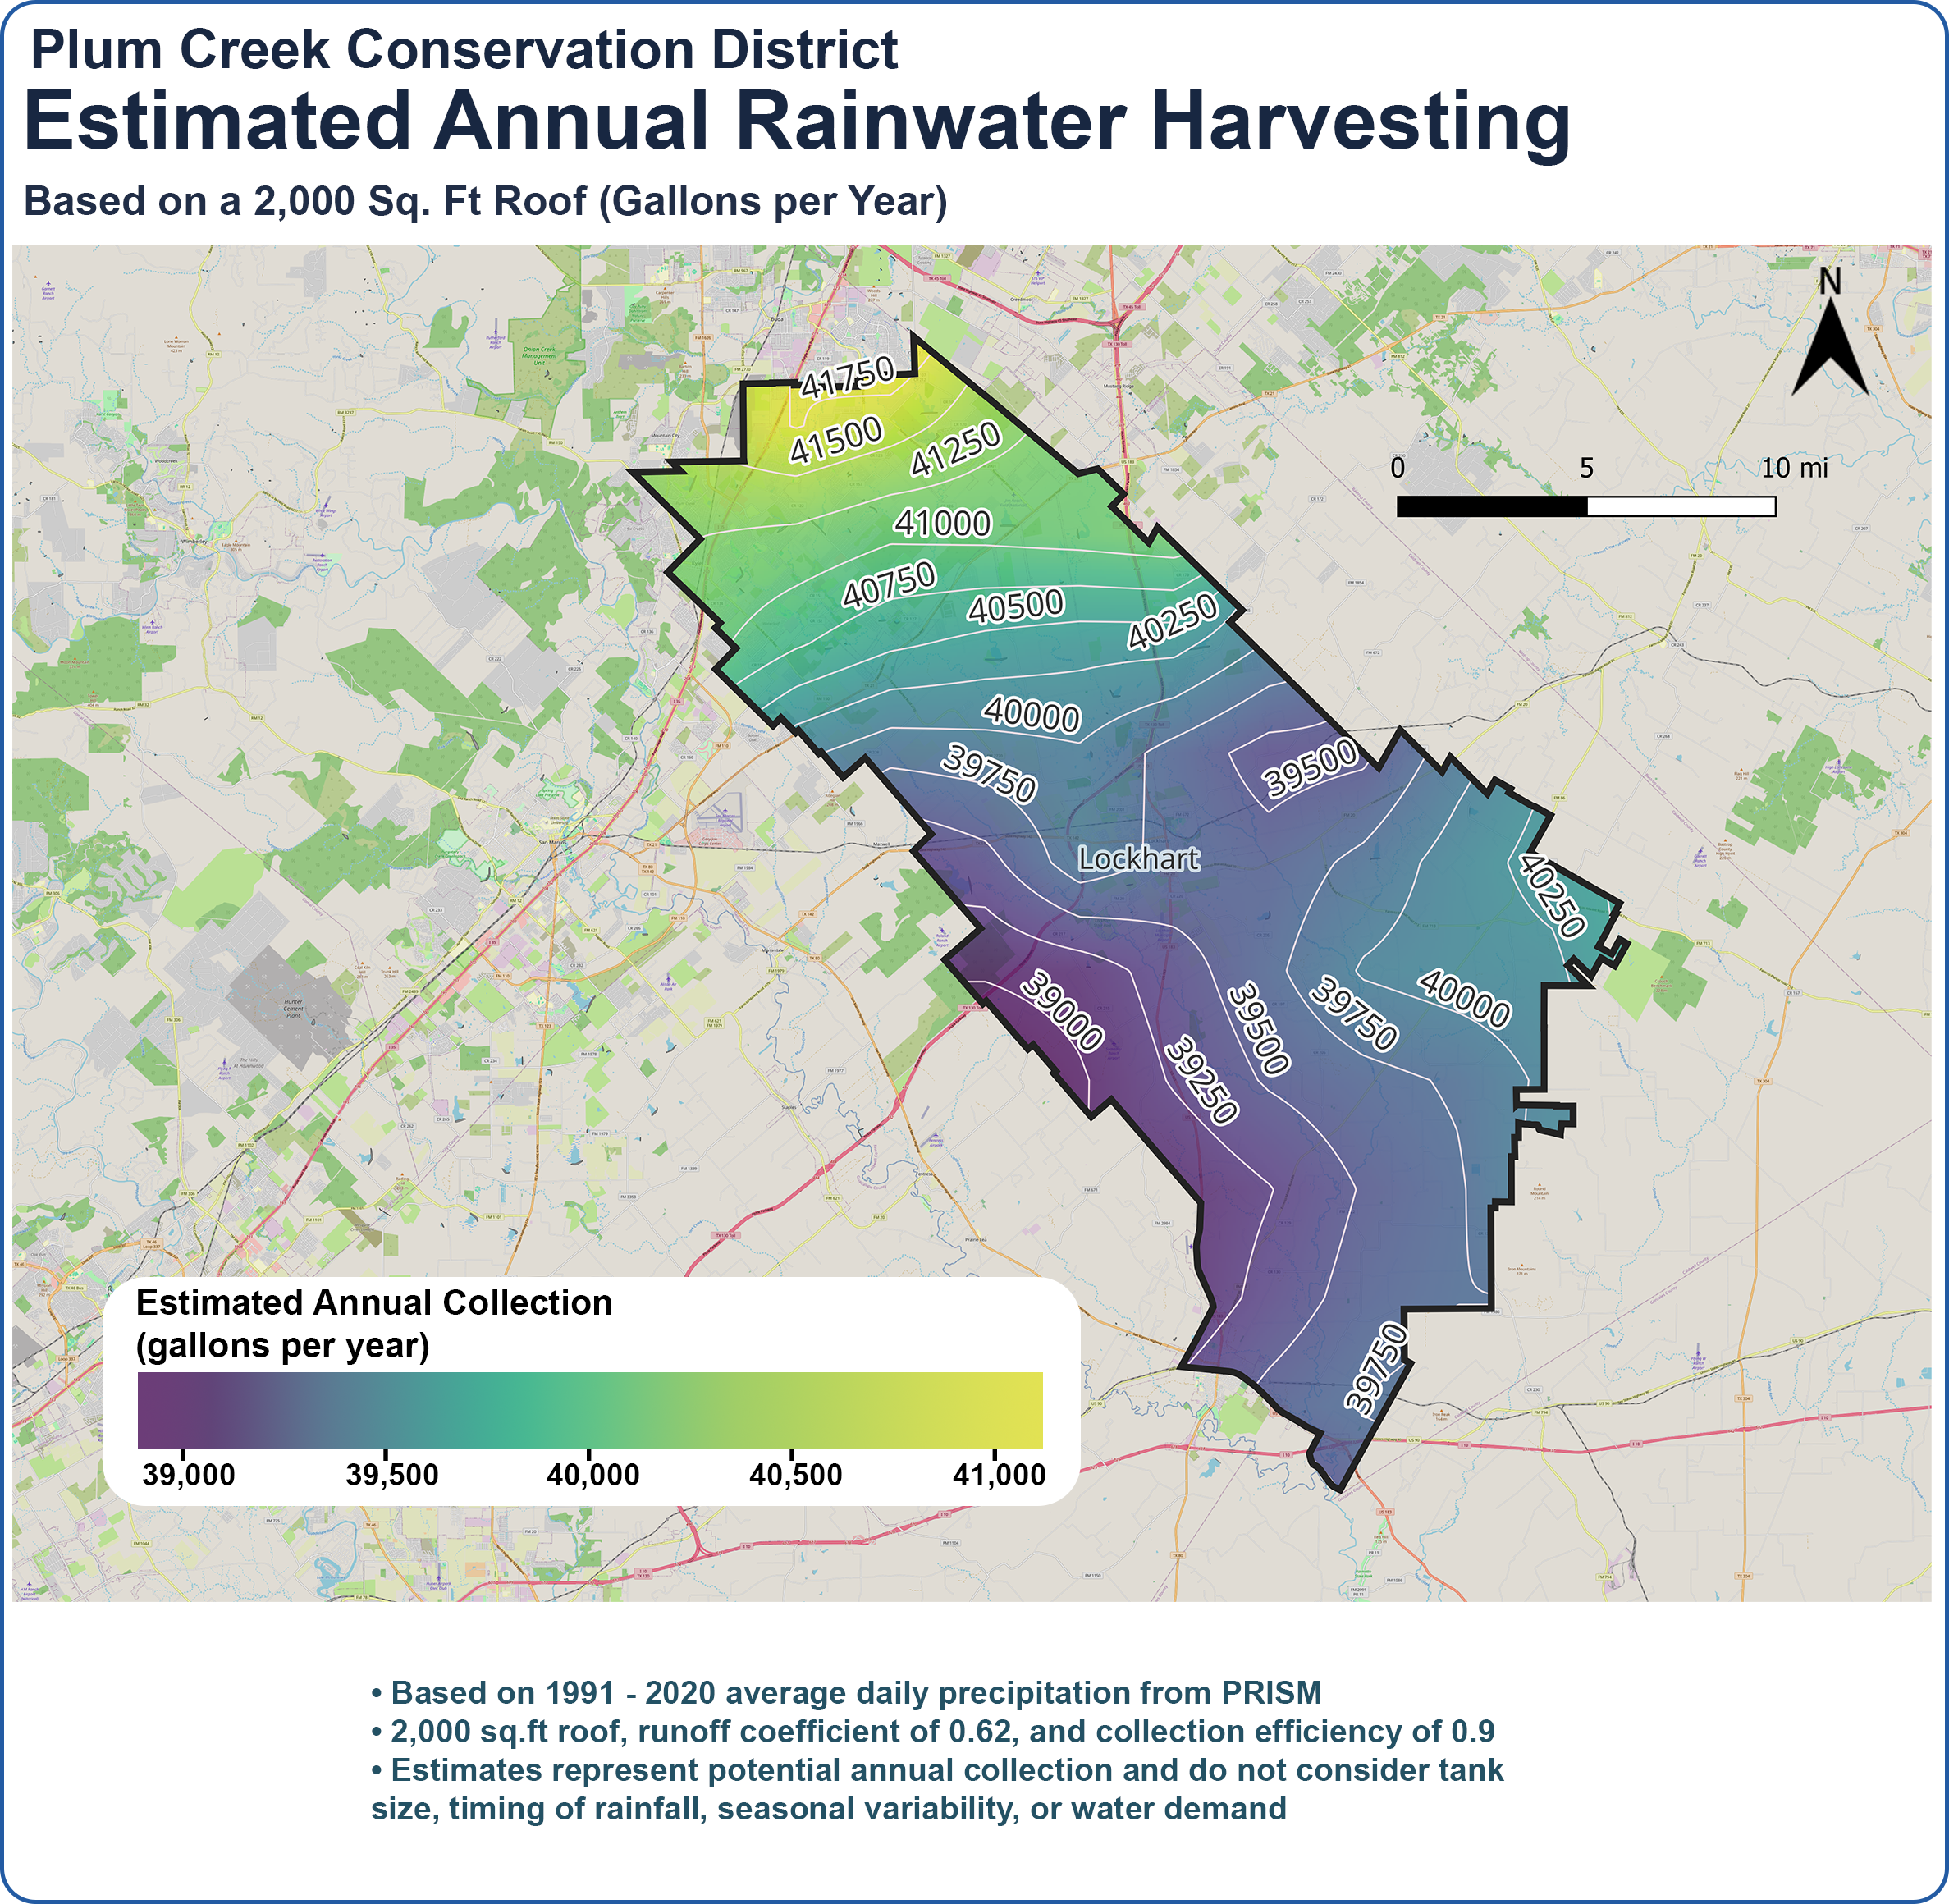
To demonstrate what these rainfall patterns mean for homeowners, we estimated annual rainwater collection across the District using a 2,000-square-foot roof, a runoff coefficient of 0.62, and a collection efficiency of 0.90. The results indicate a potential collection volume of approximately 39,000 to 42,000 gallons per year, depending on location. These estimates represent the theoretical annual collection potential after the assumed losses, rather than the amount a household could reliably use. Actual system performance depends on storage capacity, water demand, rainfall timing, and other factors.
Looking Beyond Annual Averages
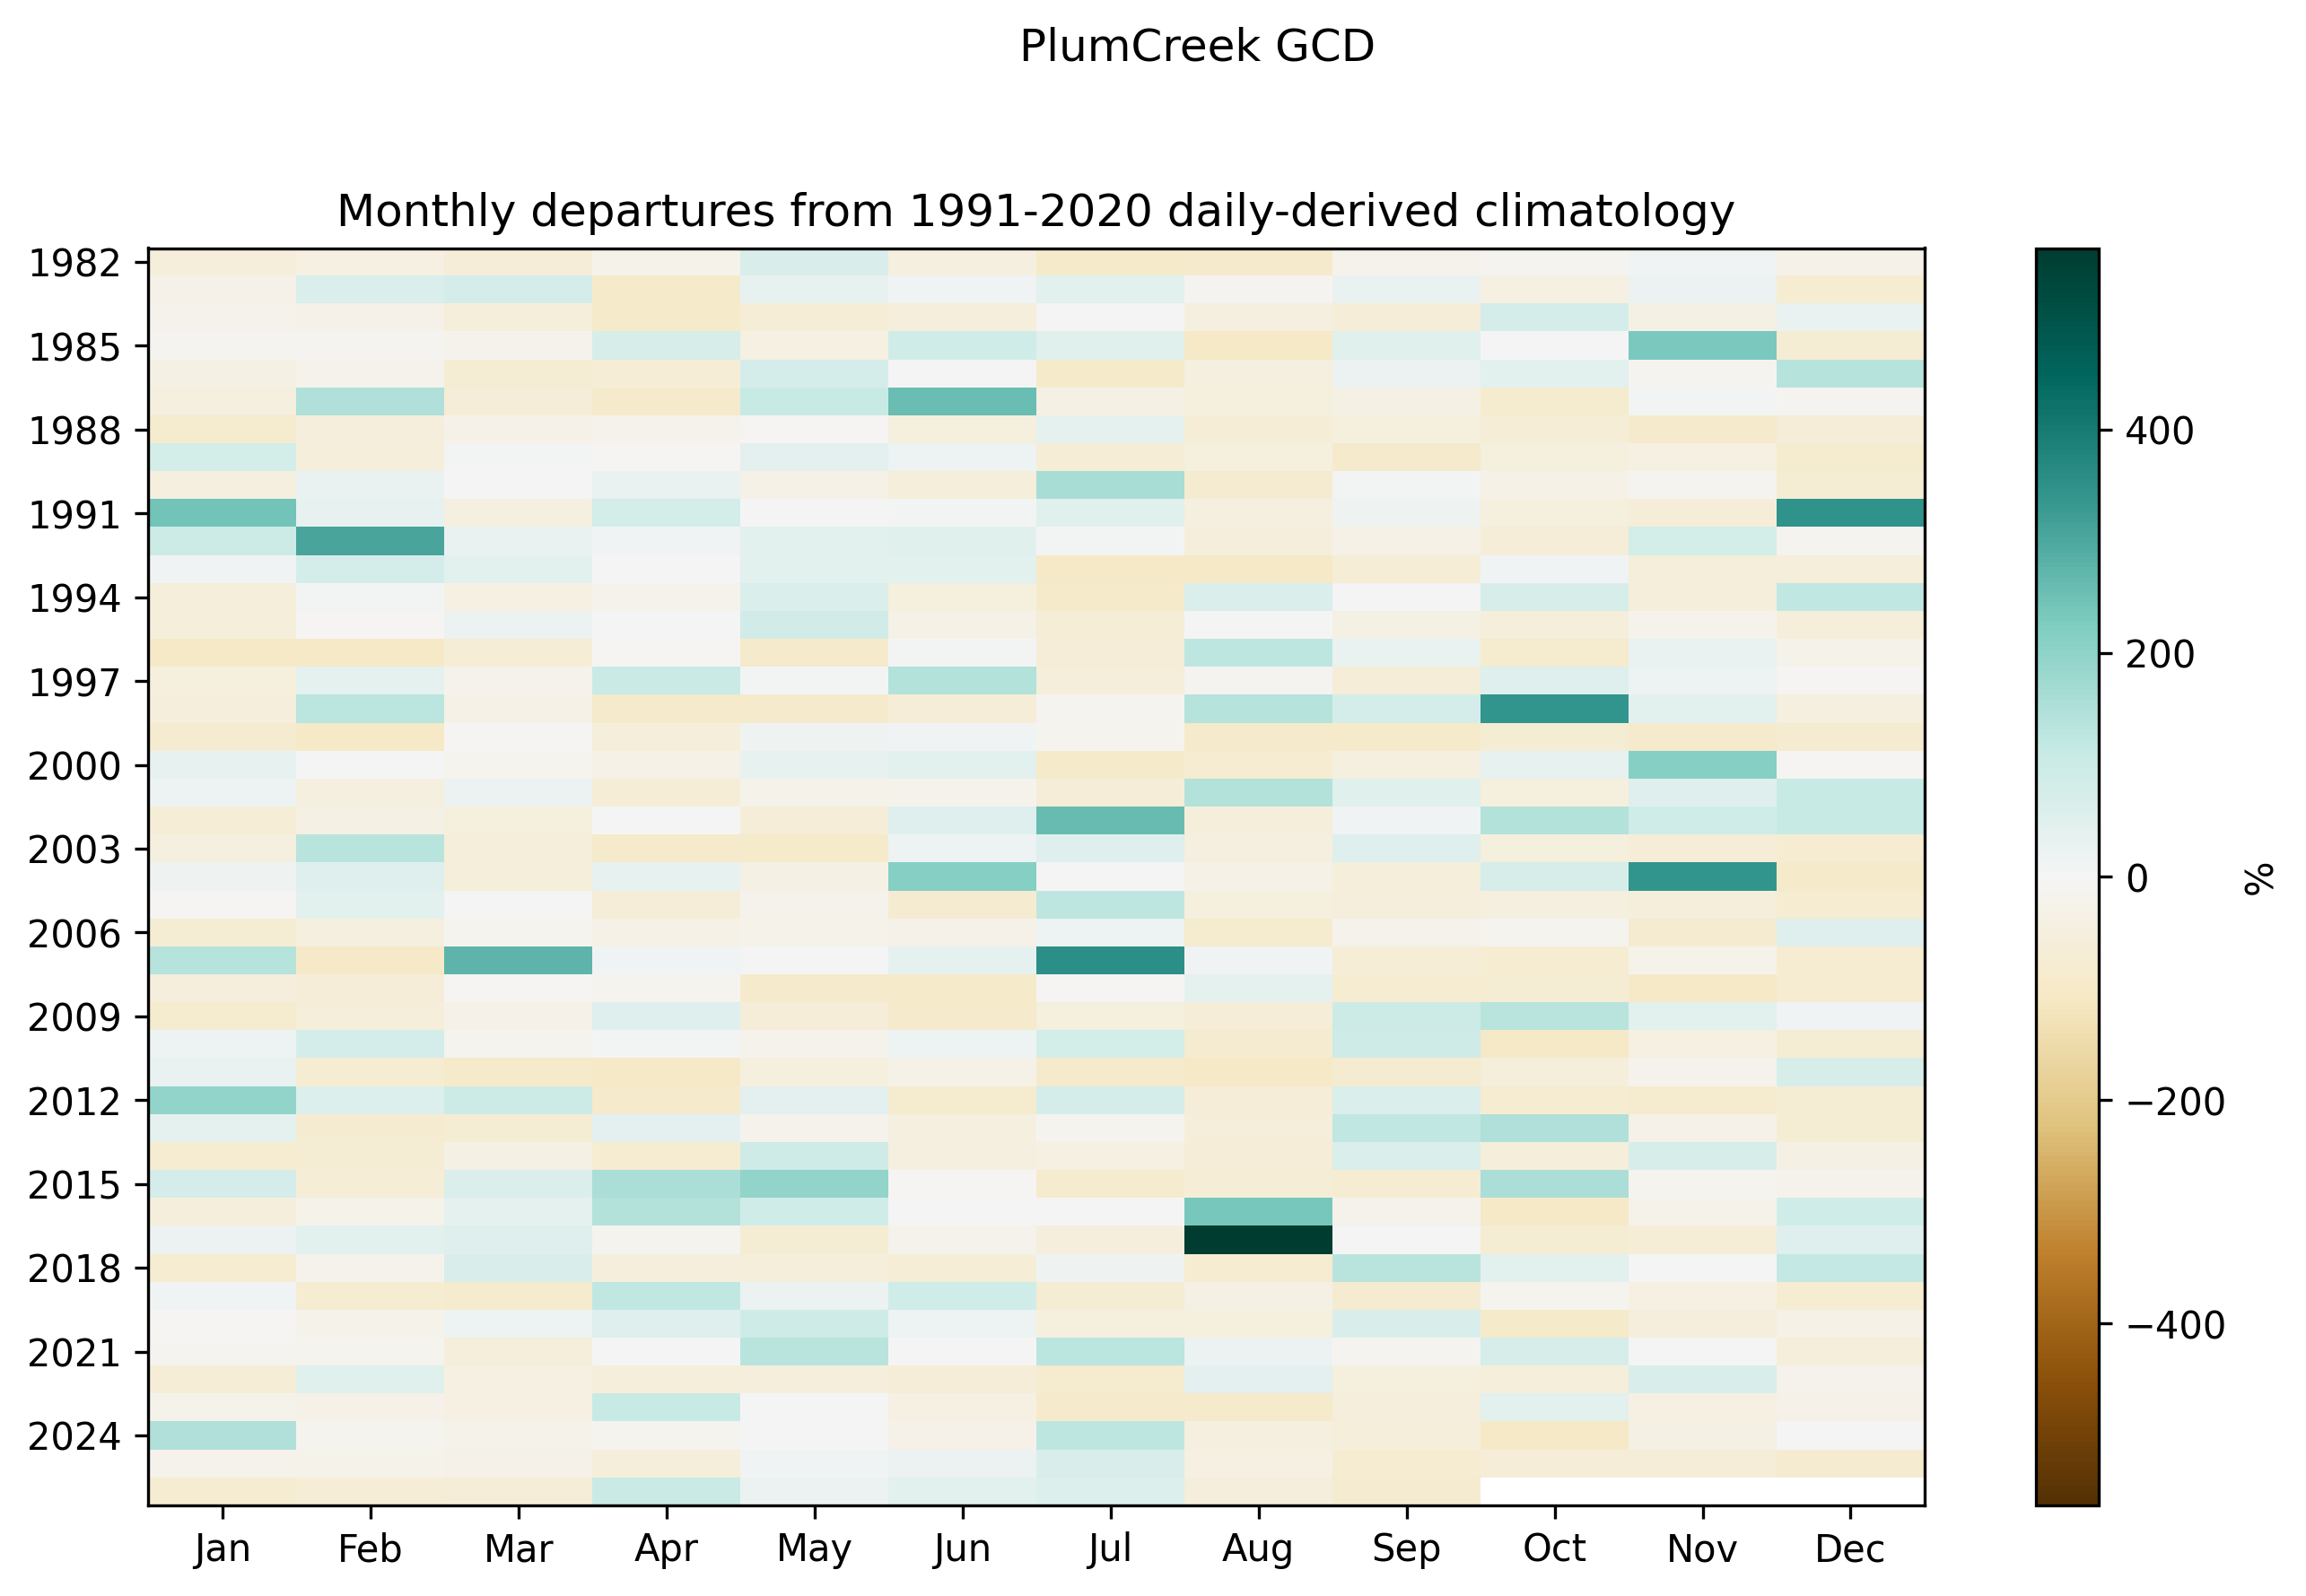
Annual rainfall totals tell only part of the story. Using daily historical precipitation records, we also examined monthly rainfall departures from the 1991–2020 climate normal to better understand how precipitation varies from year to year. The results highlight substantial variability, with individual months experiencing rainfall well above or below their historical averages. This is particularly important for rainwater harvesting because when rain falls can be just as important as how much falls. A year with near-normal precipitation can still include extended dry periods that place significant demands on stored water.
How Does 2026 Compare?
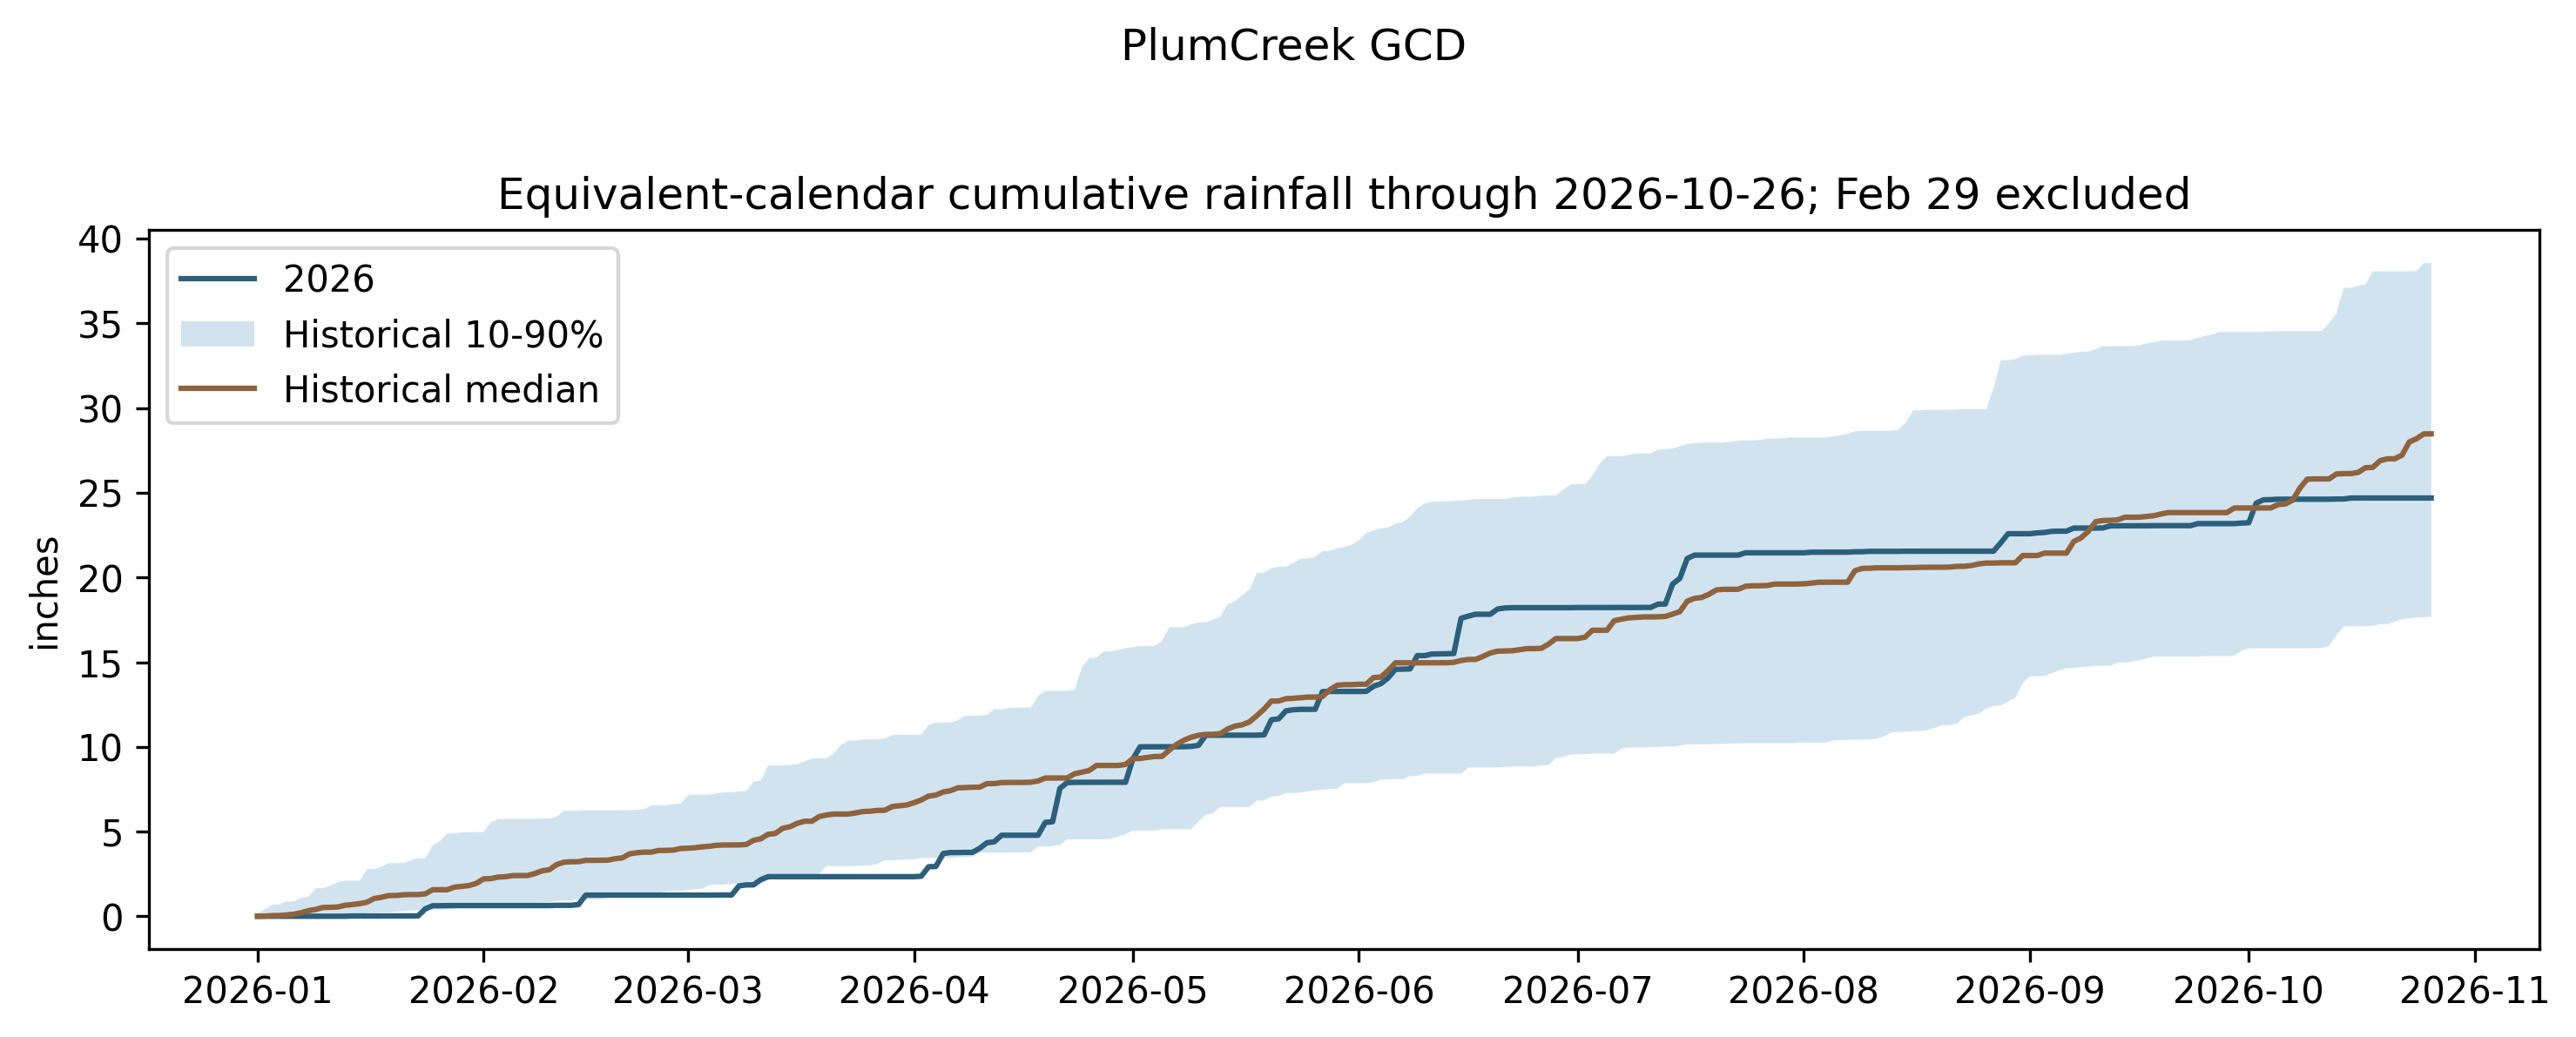
We also compared cumulative rainfall during 2026 against the historical distribution of precipitation through October 26. The District received approximately 24.7 inches of rainfall through that date, compared with a historical median of roughly 28 inches. Although rainfall during 2026 has generally remained within the historical 10th–90th percentile range, the cumulative record shows periods of limited rainfall interrupted by larger precipitation events. This reinforces the importance of evaluating historical rainfall sequences rather than relying exclusively on average annual totals when planning rainwater systems.
Putting the Data to Work
This study demonstrates how historical precipitation data and spatial analysis can support local water conservation education and rainwater harvesting planning. By combining long-term rainfall patterns, historical variability, and location-specific collection estimates, groundwater conservation districts can provide residents with more meaningful information about their local water resources. For homeowners interested in exploring their own property's potential, the free Rainwater Calculator allows users to evaluate roof area, tank sizing, water demand, and historical rainfall to better understand how a rainwater harvesting system might perform.
Data source: PRISM Climate Group, Oregon State University. Daily precipitation data at approximately 4-km spatial resolution. Rainwater collection estimates are illustrative and do not represent guaranteed water availability.